
What turnover shows
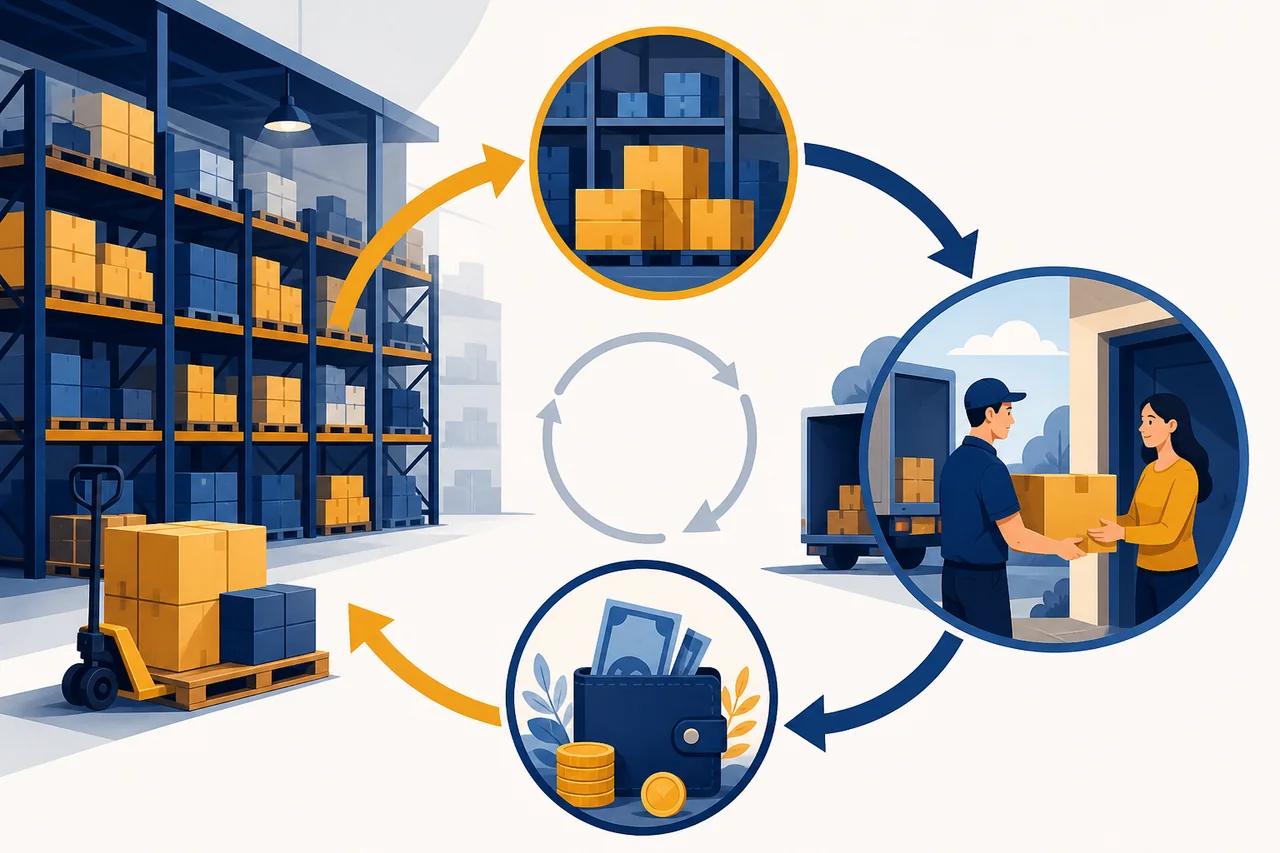
Inventory turnover divides cost of sales by average inventory to estimate how quickly stock becomes sales. Turnover of six times corresponds to roughly sixty-one inventory days. The ratio compresses the sales flow into one number, but normal ranges vary widely by industry and season.
Calculation and comparison
Use average beginning and ending inventory rather than one closing balance, and take care when annualizing a seasonal quarter. Cost of sales belongs in the numerator because inventory is also carried at cost. The result becomes useful only when compared with peers calculated consistently and the company's own history.
When turnover slows
Falling turnover can reflect weaker sales, over-ordering, obsolete products, or deliberate supply-chain purchases. Discounts and write-downs may then pressure gross margin. A temporary decline can still be reasonable when management is building safety stock against a documented shortage.
The trap of very fast turnover
A very high ratio is not automatically healthy. Too little inventory can cause stockouts, expedited shipping, and lost customers. Efficient replenishment and understocking may initially look similar, so include fulfillment rates, lead times, and revenue growth in the review.
Read the inventory mix
Manufacturers should separate raw materials, work in progress, and finished goods. More raw material may reflect supply protection, while a build-up of finished goods raises a different question about demand. IAS 2 disclosures on net realizable value, write-downs, reversals, and cost policy add necessary context.
Calculate turnover and choose a fair comparison
If cost of goods sold is 24 billion won and average inventory is 6 billion, turnover is 4 times for the period. A rise to 5 times could reflect faster sales, discounting, or a changed product mix, so compare the same industry, period, and accounting basis.
A practical interpretation order
Place turnover, inventory days, inventory and revenue growth, and gross margin on the same timeline. Then test management's supply-chain explanation against later discounts, impairments, and cash flow. The goal is not the highest ratio; it is evidence that inventory converts to cash at a sustainable pace.